
Tableau dashboards built around the decision, not the data
For teams who have Tableau (or want it) but need dashboards stakeholders actually rely on to make decisions.
Plenty of organisations have Tableau and still run the business off spreadsheets. The dashboards exist, but they are slow, cluttered, or nobody quite trusts the numbers, so people export to Excel and the investment is wasted.
The fix is rarely more charts. It is agreeing the decisions the dashboard supports, governing the metrics behind it, and designing for the person who has thirty seconds to find the answer.
Understand first, then build
- 1
Understand
We map who uses the dashboard, the decisions they make, and how success is defined, before touching Tableau. This is where most projects are won or lost.
- 2
Model
We get the data behind the view right: governed metrics, correct joins, and an extract or live connection that performs. A fast, trustworthy source is half the battle.
- 3
Design & build
We design for the decision: clear hierarchy, the key number first, drill-downs that answer the next question. Then we build, test with real users, and tune performance.
- 4
Hand over
We publish to Tableau Server or Cloud, set row-level security and refresh schedules, and train your team so you own it, not depend on us.
Concrete deliverables
- Dashboard design and build in Tableau Desktop
- Data source modelling, governed calculations and performance tuning
- Tableau Server / Tableau Cloud publishing, security and scheduled refresh
- Embedded analytics into your portal or product
- Team training and documentation so you can maintain it in-house
Tools we typically use
- Tableau
- Snowflake
- SQL
- Alteryx
- Python
Not sure which tool fits? That’s our job. We recommend based on your stack and team, not our preferences.
Talk it through with usRelated work
RACQ
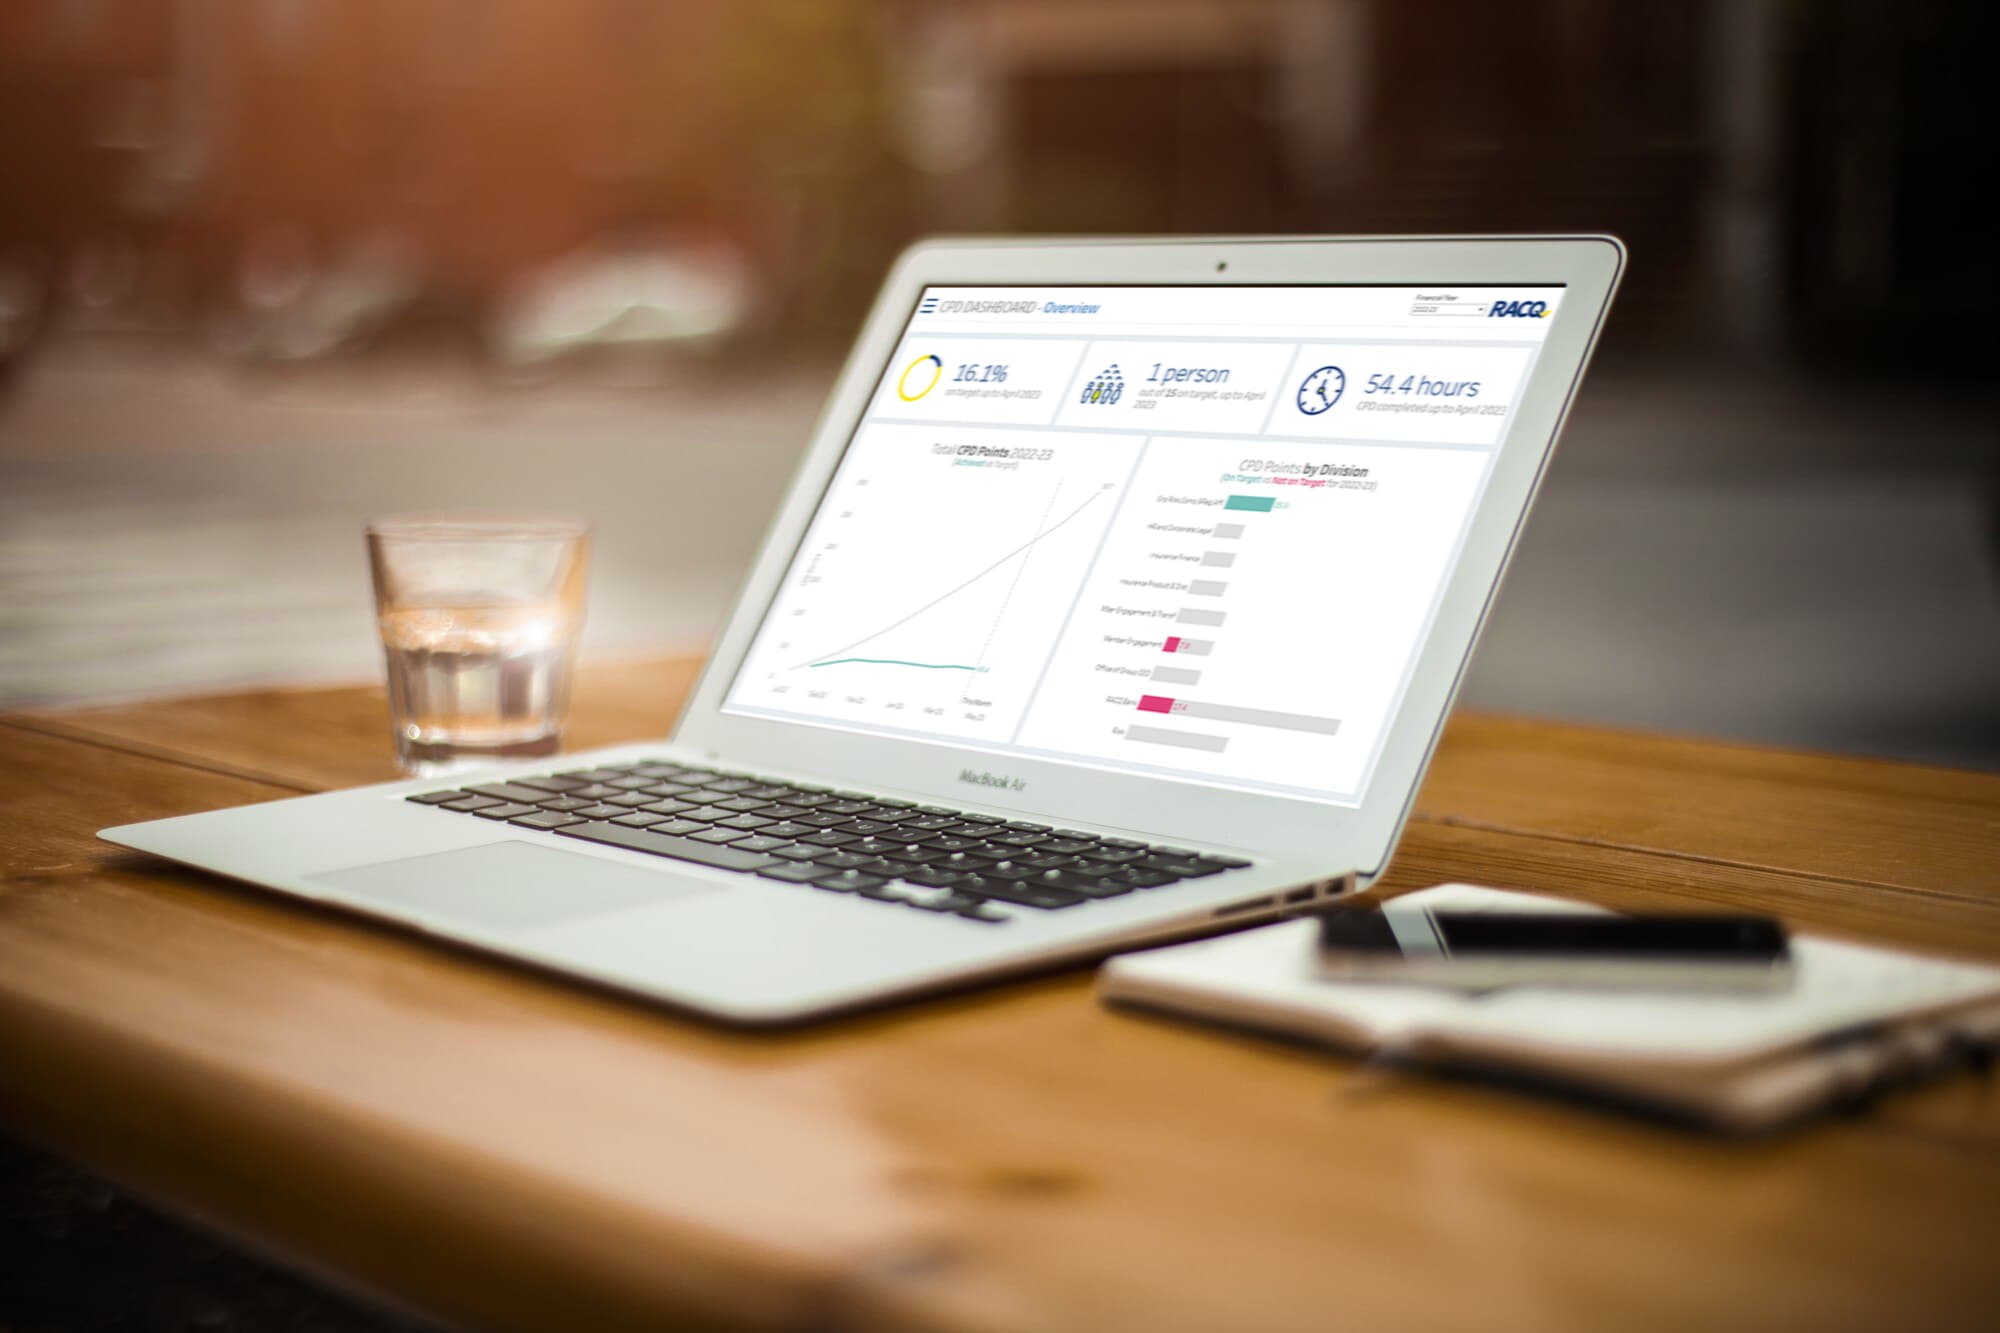
We designed and productionised Tableau dashboards to track employees' professional development, automating data capture and helping RACQ refine training policy.
Clean, trusted dashboards adopted by stakeholders
Read the case study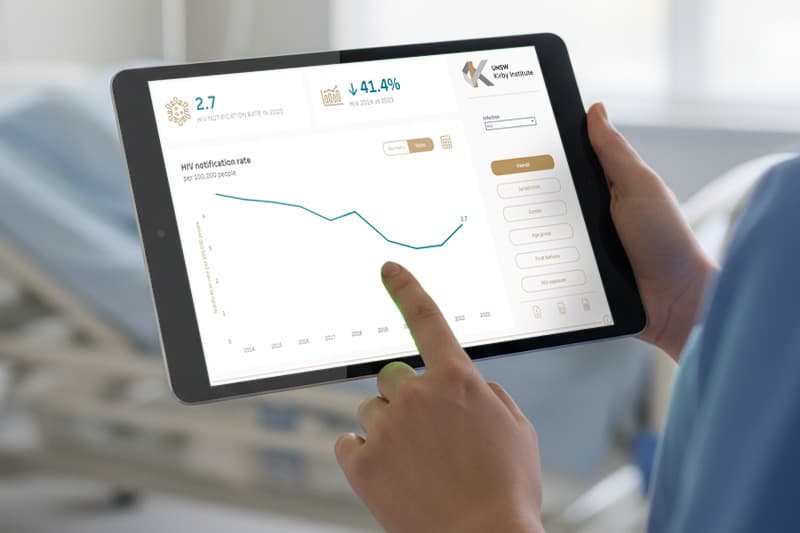
Kirby Institute (UNSW)
We built interactive Tableau dashboards tracking STIs across Australia, embedded in the institute's portal for exploration by region, gender, age group and infection type.
A new organisational standard for surveillance reporting
Read the case study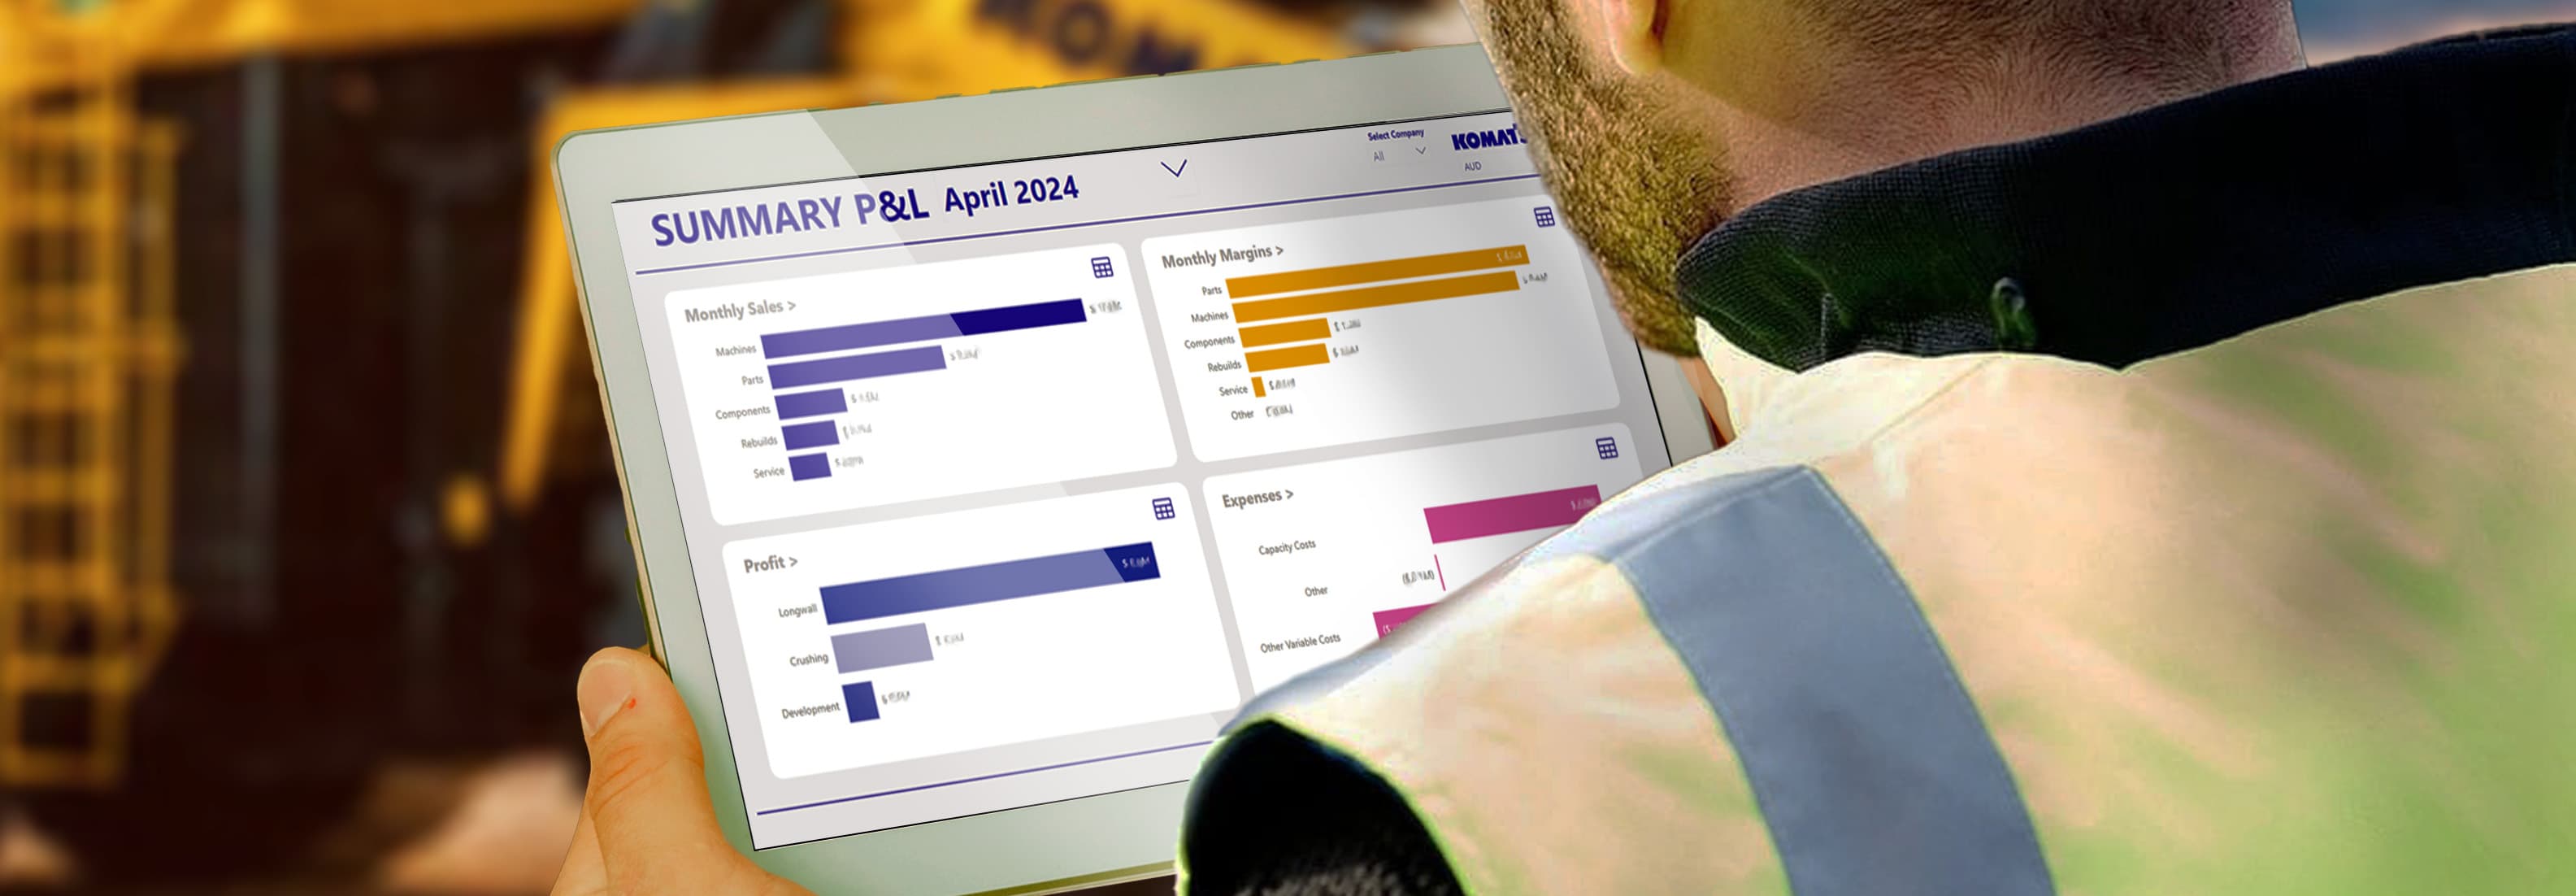
Komatsu Australia
We transitioned Komatsu Australia from a cumbersome manual process to automated financial reporting in Power BI, integrating data from SAP and Palantir Foundry.
50+ staff hours saved every month
Read the case studyThe questions buyers ask us
- How much does a Tableau consultant cost in Brisbane?
- It depends on scope, but most engagements fall into two shapes. A focused dashboard build (discovery, data modelling, design and handover) typically runs as a fixed-price package over a few weeks. Ongoing work is billed at a day rate. We always scope and quote before starting, so there are no surprises. Book a free consultation and we will give you a realistic range for your project.
- Should we use Tableau or Power BI?
- Both are excellent. Power BI is usually the pragmatic choice if you already run Microsoft 365 and Azure, because licensing and integration are simpler. Tableau tends to win when visual analysis, interactivity and design polish matter most, or when you are embedding analytics for external users. We work in both and will recommend the one that fits your stack and your team, not the one we feel like building.
- Can you fix or take over an existing Tableau environment?
- Yes. A lot of our work is rescuing dashboards that grew messy: slow workbooks, duplicated metrics, no governance. We audit what you have, fix performance and data-model issues, consolidate the metrics, and leave you with documentation and a maintainable set of workbooks.
- Do you work with Tableau Cloud and embedded analytics?
- Yes. We publish to Tableau Server and Tableau Cloud, configure row-level security and refresh schedules, and embed dashboards into portals and products, including public-facing sites, as we did for the Kirby Institute's national health surveillance dashboards.
- Do you offer Tableau consulting in Brisbane?
- Yes. Motta Consulting is a Brisbane-based Tableau consultant working with clients across Brisbane and all of Australia. We cover the full engagement: dashboard design, data modelling, Tableau Server and Cloud publishing, performance tuning and team training. Book a free consultation to talk through your project.
More in Data Visualisation
Power BI reporting that runs itself
For finance and operations teams drowning in manual monthly reporting who want it automated, accurate and on time.
Learn moreReporting automationStop rebuilding the same report every month
For any team that spends days each month copying, pasting and reconciling data into a report by hand.
Learn moreCustom data web appsCustom data web apps when a dashboard is not enough
For organisations whose need has outgrown a BI tool: they need data capture, workflow, or a fully bespoke interface.
Learn moreReady to talk it through?
For teams who have Tableau (or want it) but need dashboards stakeholders actually rely on to make decisions.