
Power BI reporting that runs itself
For finance and operations teams drowning in manual monthly reporting who want it automated, accurate and on time.
Manual reporting is expensive twice: the hours spent building it, and the decisions delayed while everyone waits for it. Numbers get keyed by hand, versions diverge, and the month-end pack is out of date the moment it is sent.
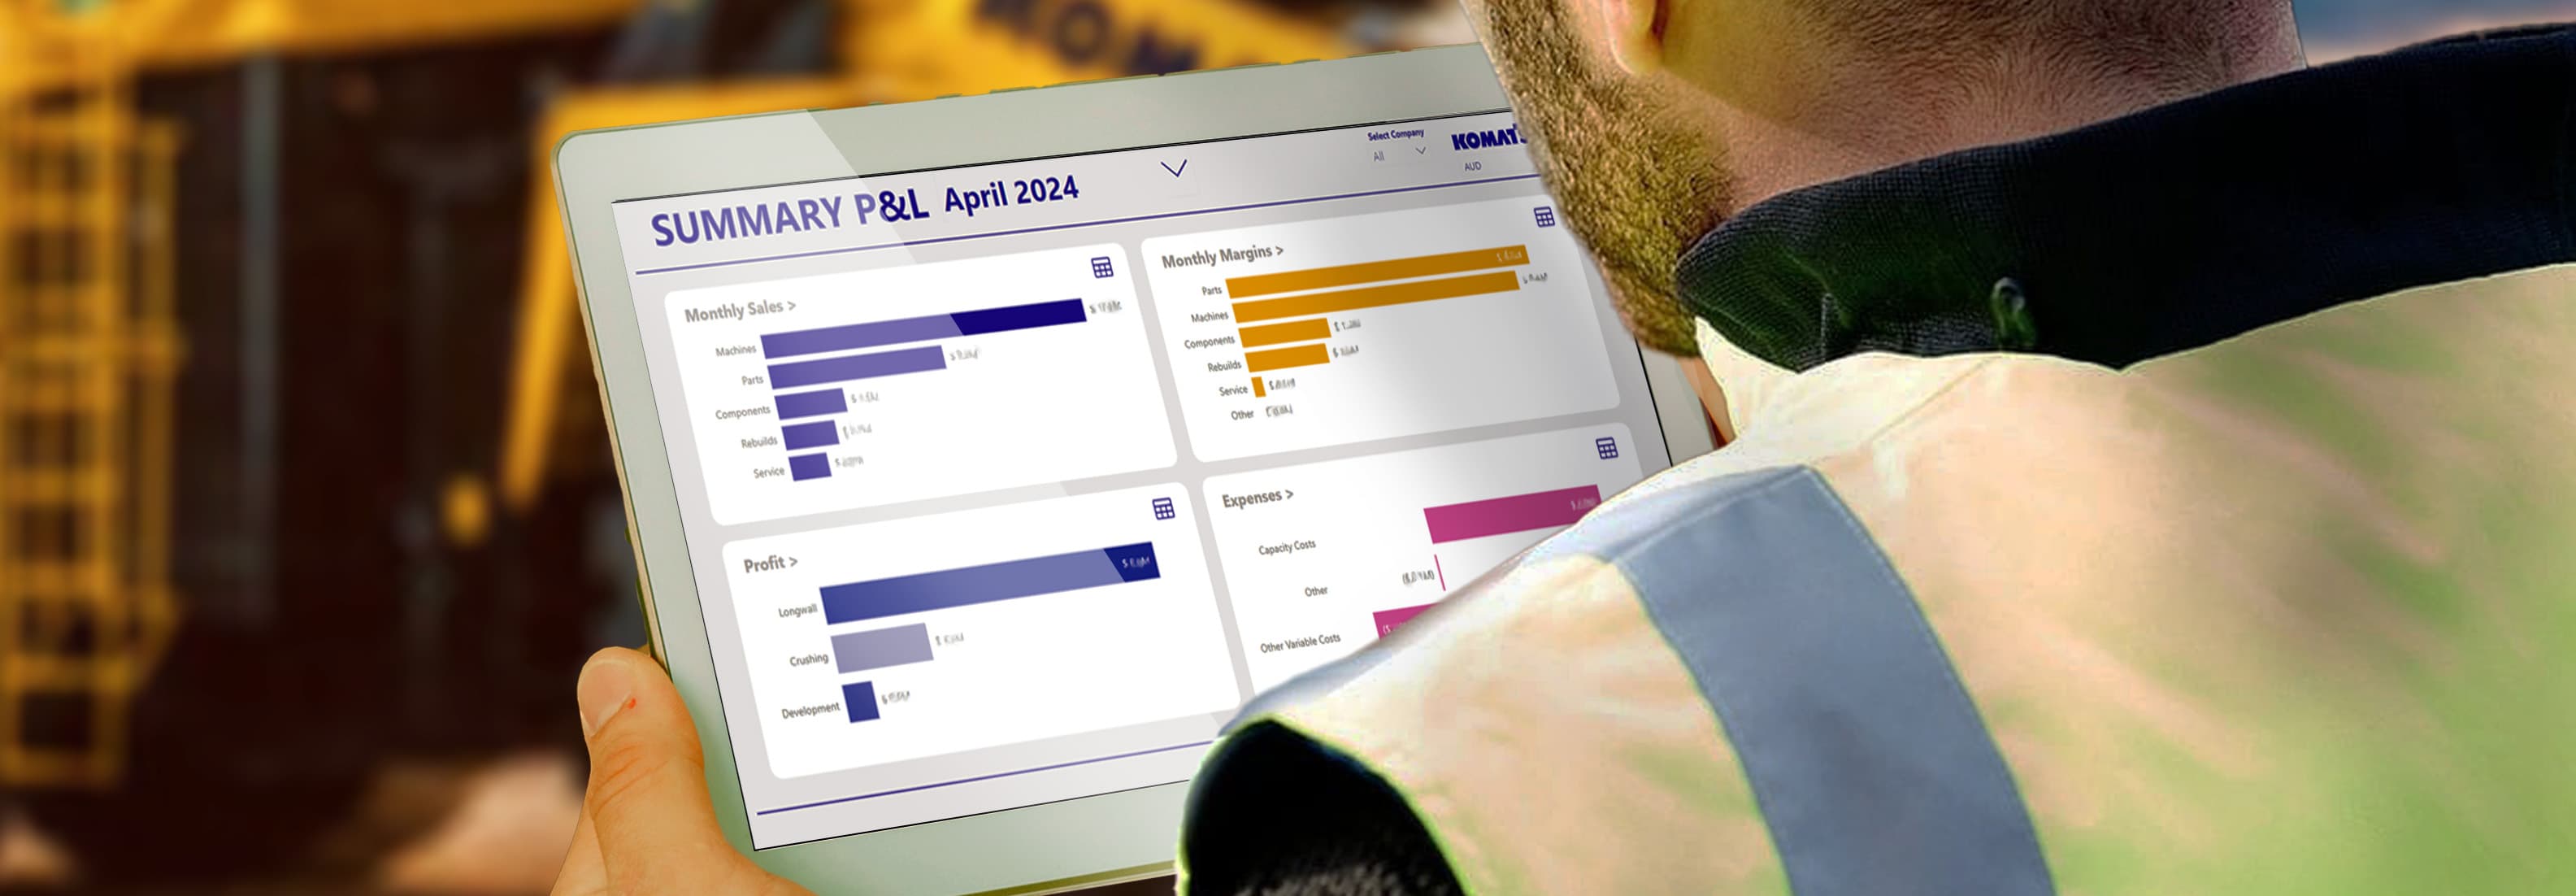
Power BI done properly replaces that with a governed model that refreshes automatically. We transitioned Komatsu Australia from a manual process to automated financial reporting and saved them over 50 staff hours a month.
Understand first, then build
- 1
Understand
We start with the reports you produce and the decisions they drive, then trace each number back to its source system: SAP, your ERP, spreadsheets, whatever it is.
- 2
Model
We build a clean star-schema data model with well-tested DAX measures, so the numbers are defined once and reconcile to source.
- 3
Automate
We connect the pipelines, set scheduled refresh, and remove the manual steps, so the report is ready before the meeting, every time.
- 4
Govern & train
We set workspace roles, row-level security and a certified dataset, then train your team to build their own reports on top of the trusted model.
Concrete deliverables
- Power BI data model, DAX measures and report design
- Automated refresh from SAP, ERP, databases, SharePoint and Excel
- Financial and operational reporting packs that reconcile to source
- Row-level security, certified datasets and workspace governance
- Microsoft Fabric / Azure integration where it fits
- Team training and documentation
Tools we typically use
- Power BI
- Microsoft Fabric
- Azure
- SQL
- Python
Not sure which tool fits? That’s our job. We recommend based on your stack and team, not our preferences.
Talk it through with usRelated work
RACQ
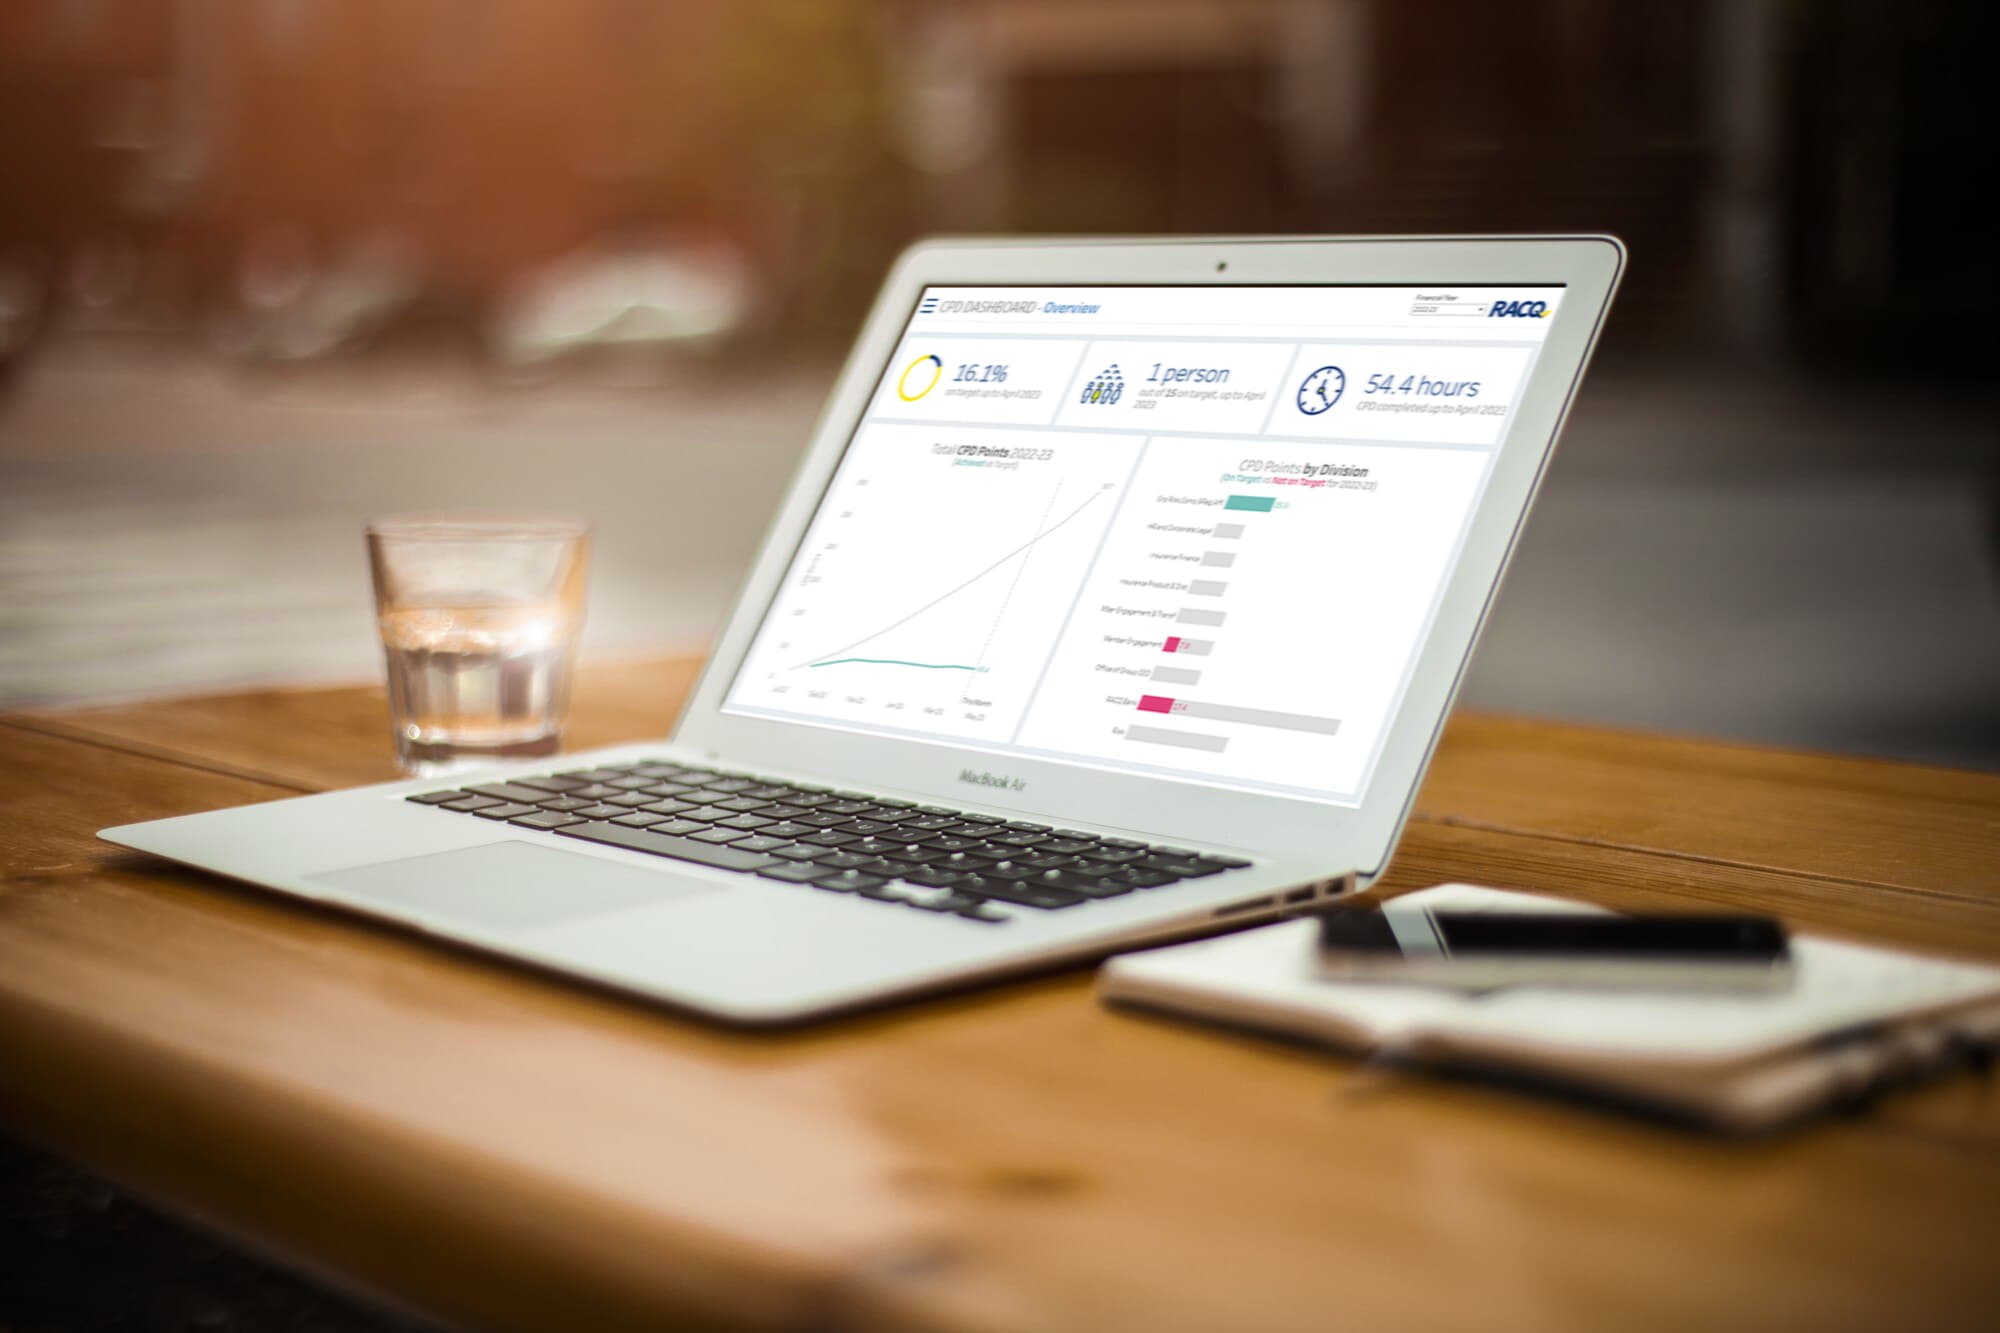
We designed and productionised Tableau dashboards to track employees' professional development, automating data capture and helping RACQ refine training policy.
Clean, trusted dashboards adopted by stakeholders
Read the case study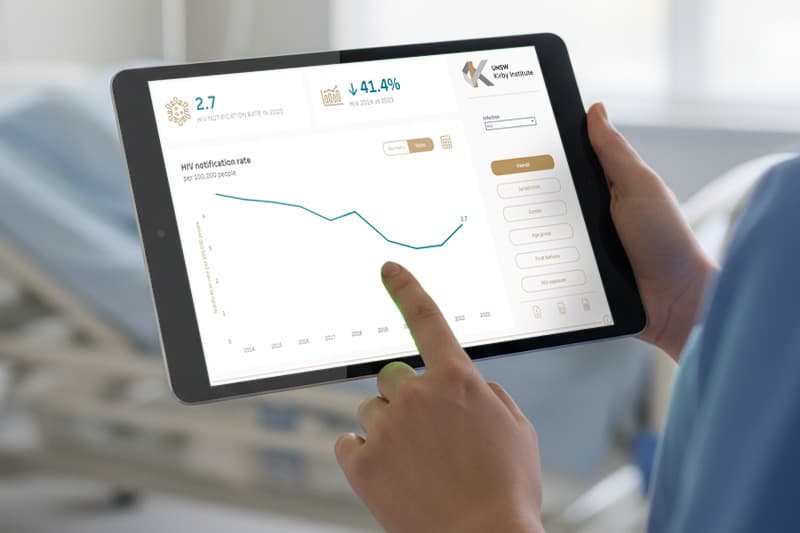
Kirby Institute (UNSW)
We built interactive Tableau dashboards tracking STIs across Australia, embedded in the institute's portal for exploration by region, gender, age group and infection type.
A new organisational standard for surveillance reporting
Read the case studyKomatsu Australia
We transitioned Komatsu Australia from a cumbersome manual process to automated financial reporting in Power BI, integrating data from SAP and Palantir Foundry.
50+ staff hours saved every month
Read the case studyThe questions buyers ask us
- How much does Power BI consulting cost in Australia?
- Most first engagements are a fixed-price build (discovery, data model, a core report pack and handover) scoped over a few weeks. Ongoing enhancement or support is a day rate or a small monthly plan. We scope and quote up front. Book a free consultation for a range specific to your reporting.
- Can Power BI automate our monthly financial reporting?
- Yes, and it is one of the most common things we do. We connect Power BI to your source systems, model the numbers so they reconcile, and schedule automatic refresh, so the monthly pack builds itself. For Komatsu Australia this removed a manual process and saved over 50 staff hours per month.
- Do you work with Microsoft Fabric?
- Yes. Where it makes sense we use Microsoft Fabric for the data engineering layer beneath Power BI (lakehouse storage, pipelines and a semantic model) so reporting and the underlying data platform are one governed system rather than two.
- We already have Power BI but it is a mess. Can you help?
- Absolutely. We audit sprawling workspaces, consolidate duplicated measures into a governed model, fix refresh failures and performance, and leave you with a certified dataset your team can trust and build on.
- Do you offer Power BI consulting in Brisbane?
- Yes. Motta Consulting is a Brisbane-based Power BI consultant serving clients across Brisbane and all of Australia. We build governed data models, DAX measures and automated financial and operational reporting, and we transitioned Komatsu Australia to automated reporting that saved over 50 staff hours a month. Book a free consultation to scope your reporting.
More in Data Visualisation
Tableau dashboards built around the decision, not the data
For teams who have Tableau (or want it) but need dashboards stakeholders actually rely on to make decisions.
Learn moreReporting automationStop rebuilding the same report every month
For any team that spends days each month copying, pasting and reconciling data into a report by hand.
Learn moreCustom data web appsCustom data web apps when a dashboard is not enough
For organisations whose need has outgrown a BI tool: they need data capture, workflow, or a fully bespoke interface.
Learn moreReady to talk it through?
For finance and operations teams drowning in manual monthly reporting who want it automated, accurate and on time.