
Stop rebuilding the same report every month
For any team that spends days each month copying, pasting and reconciling data into a report by hand.
Manual reporting quietly consumes some of your most capable people. The work is repetitive, error-prone and never finished: as soon as one cycle ends, the next begins.
Reporting automation removes the handle-cranking. We connect the sources, encode the transformations once, and let the report refresh on a schedule, freeing your analysts for the work only they can do.
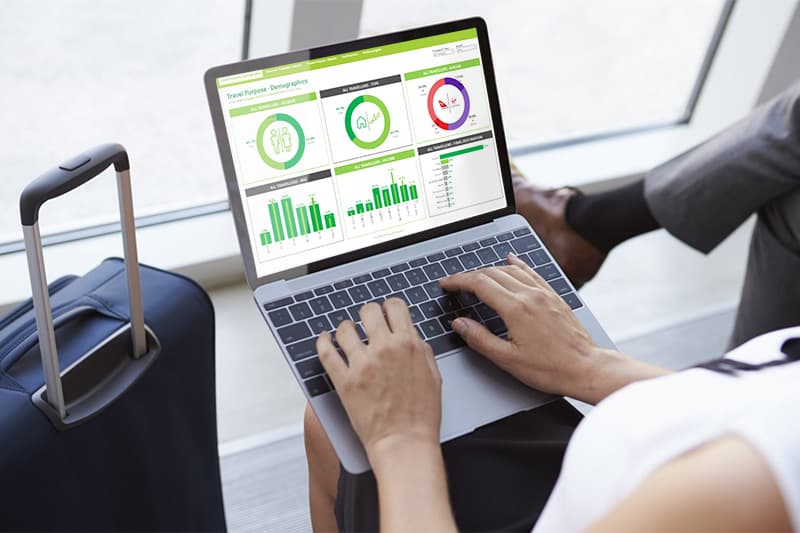
Understand first, then build
- 1
Understand
We document the report you produce today, step by step, and the decisions it feeds, so nothing is lost in automation.
- 2
Automate the pipeline
We replace the manual collection and cleaning with a repeatable pipeline in SQL, Python or Alteryx, connected straight to source.
- 3
Automate the report
We rebuild the output in Tableau or Power BI with scheduled refresh, including dynamic commentary that updates as the data changes.
- 4
Prove and hand over
We reconcile the automated output against your current report, then hand it over with documentation so it keeps running without us.
Concrete deliverables
- Automated ETL/ELT pipelines (SQL, Python, Alteryx)
- Scheduled, self-refreshing dashboards in Tableau or Power BI
- Dynamic narrative/commentary that responds to the data
- Reconciliation against your existing reports
- Documentation and handover
Tools we typically use
- Alteryx
- Tableau
- Power BI
- Python
- SQL
Not sure which tool fits? That’s our job. We recommend based on your stack and team, not our preferences.
Talk it through with usRelated work
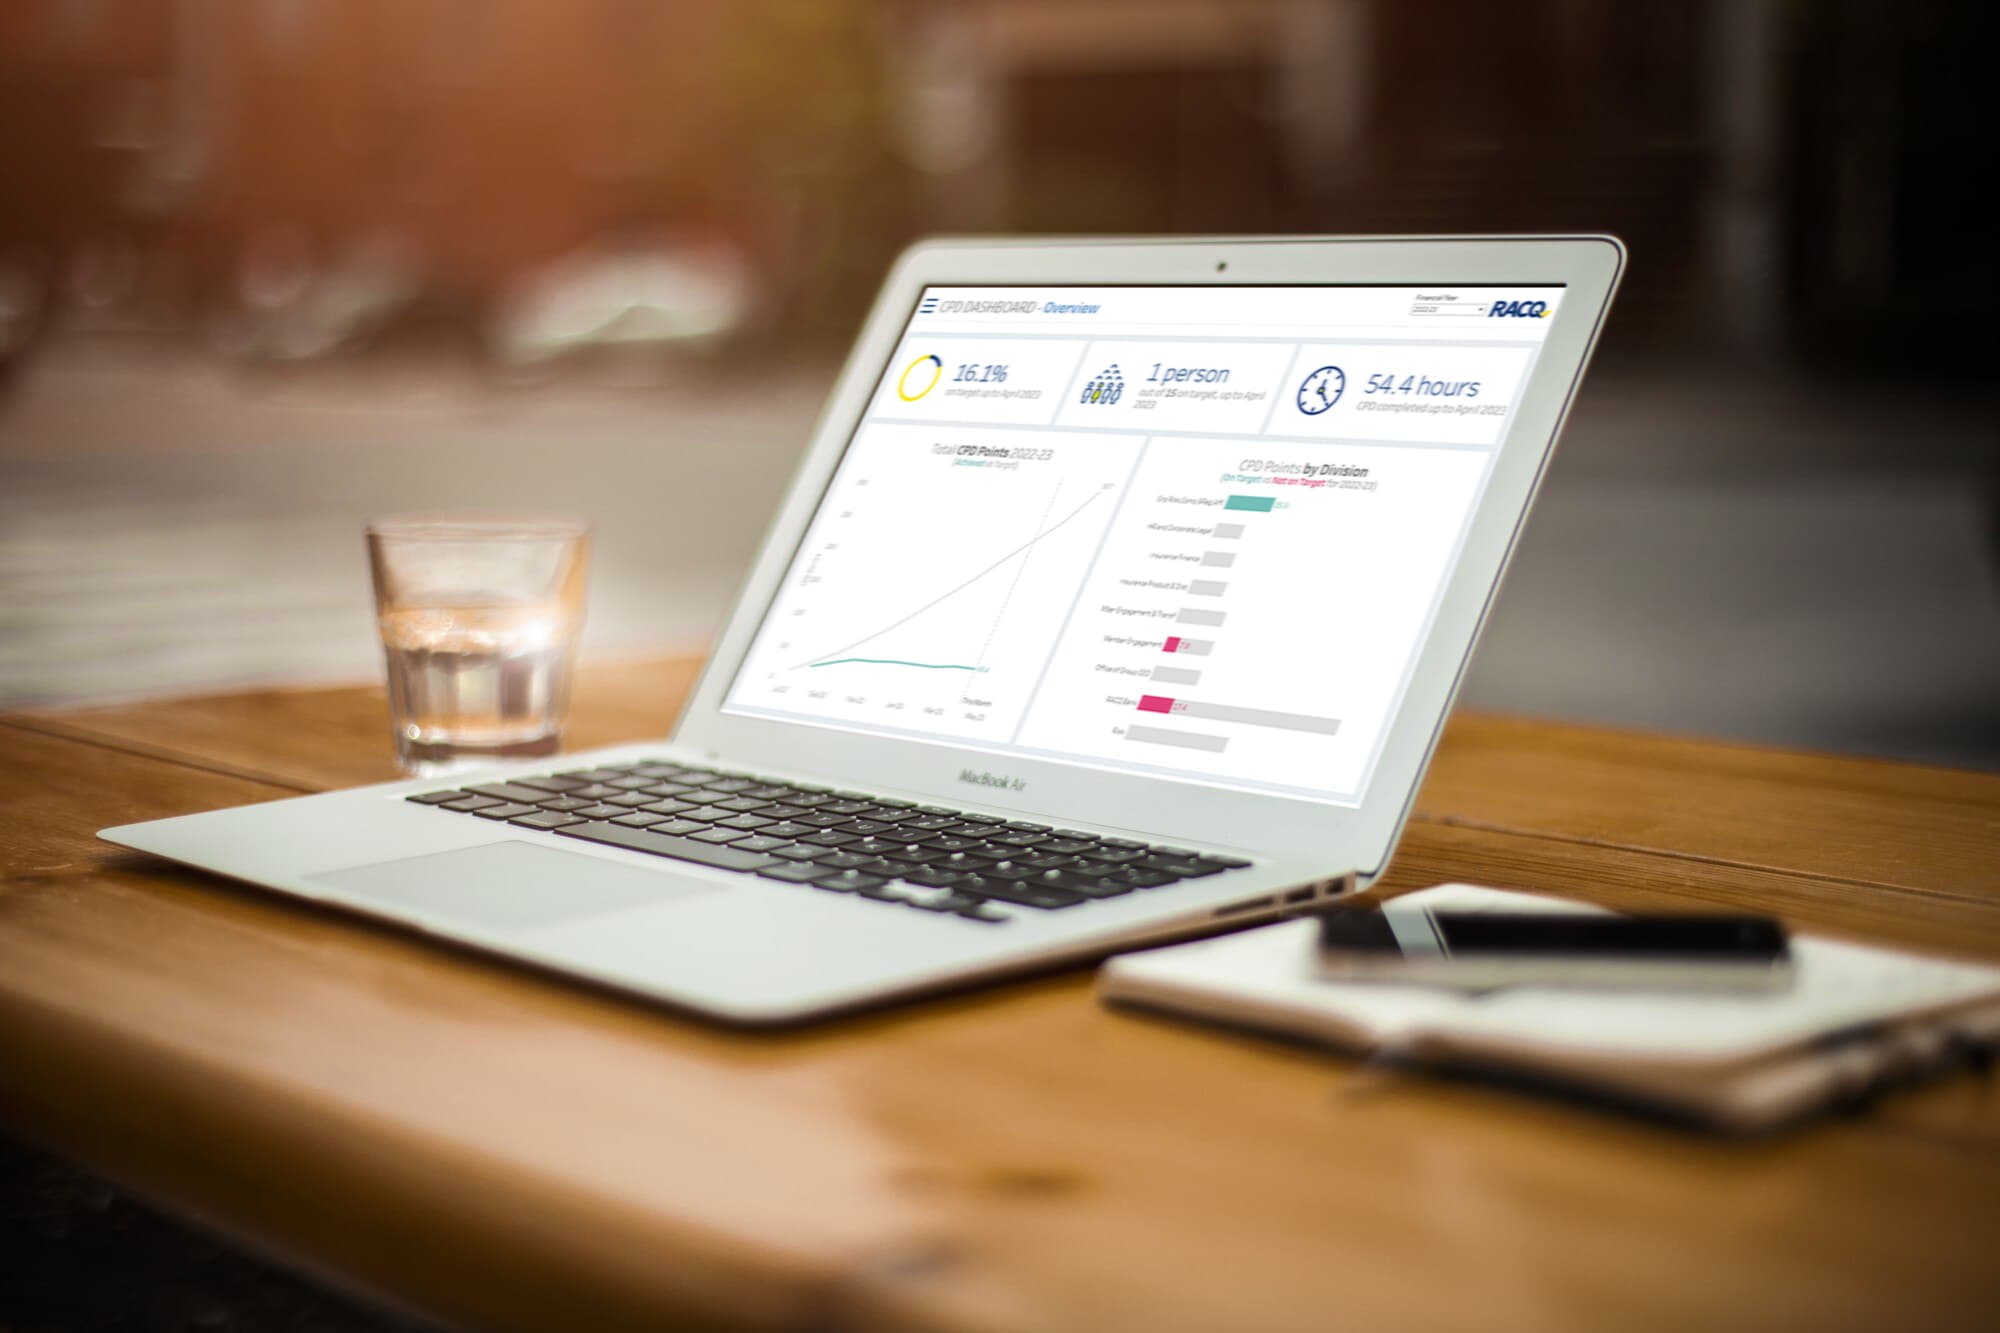
RACQ
We designed and productionised Tableau dashboards to track employees' professional development, automating data capture and helping RACQ refine training policy.
Clean, trusted dashboards adopted by stakeholders
Read the case study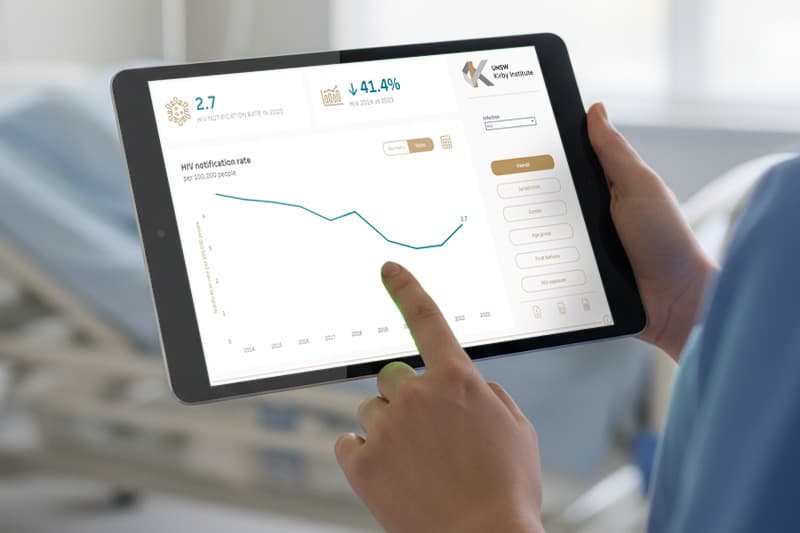
Kirby Institute (UNSW)
We built interactive Tableau dashboards tracking STIs across Australia, embedded in the institute's portal for exploration by region, gender, age group and infection type.
A new organisational standard for surveillance reporting
Read the case study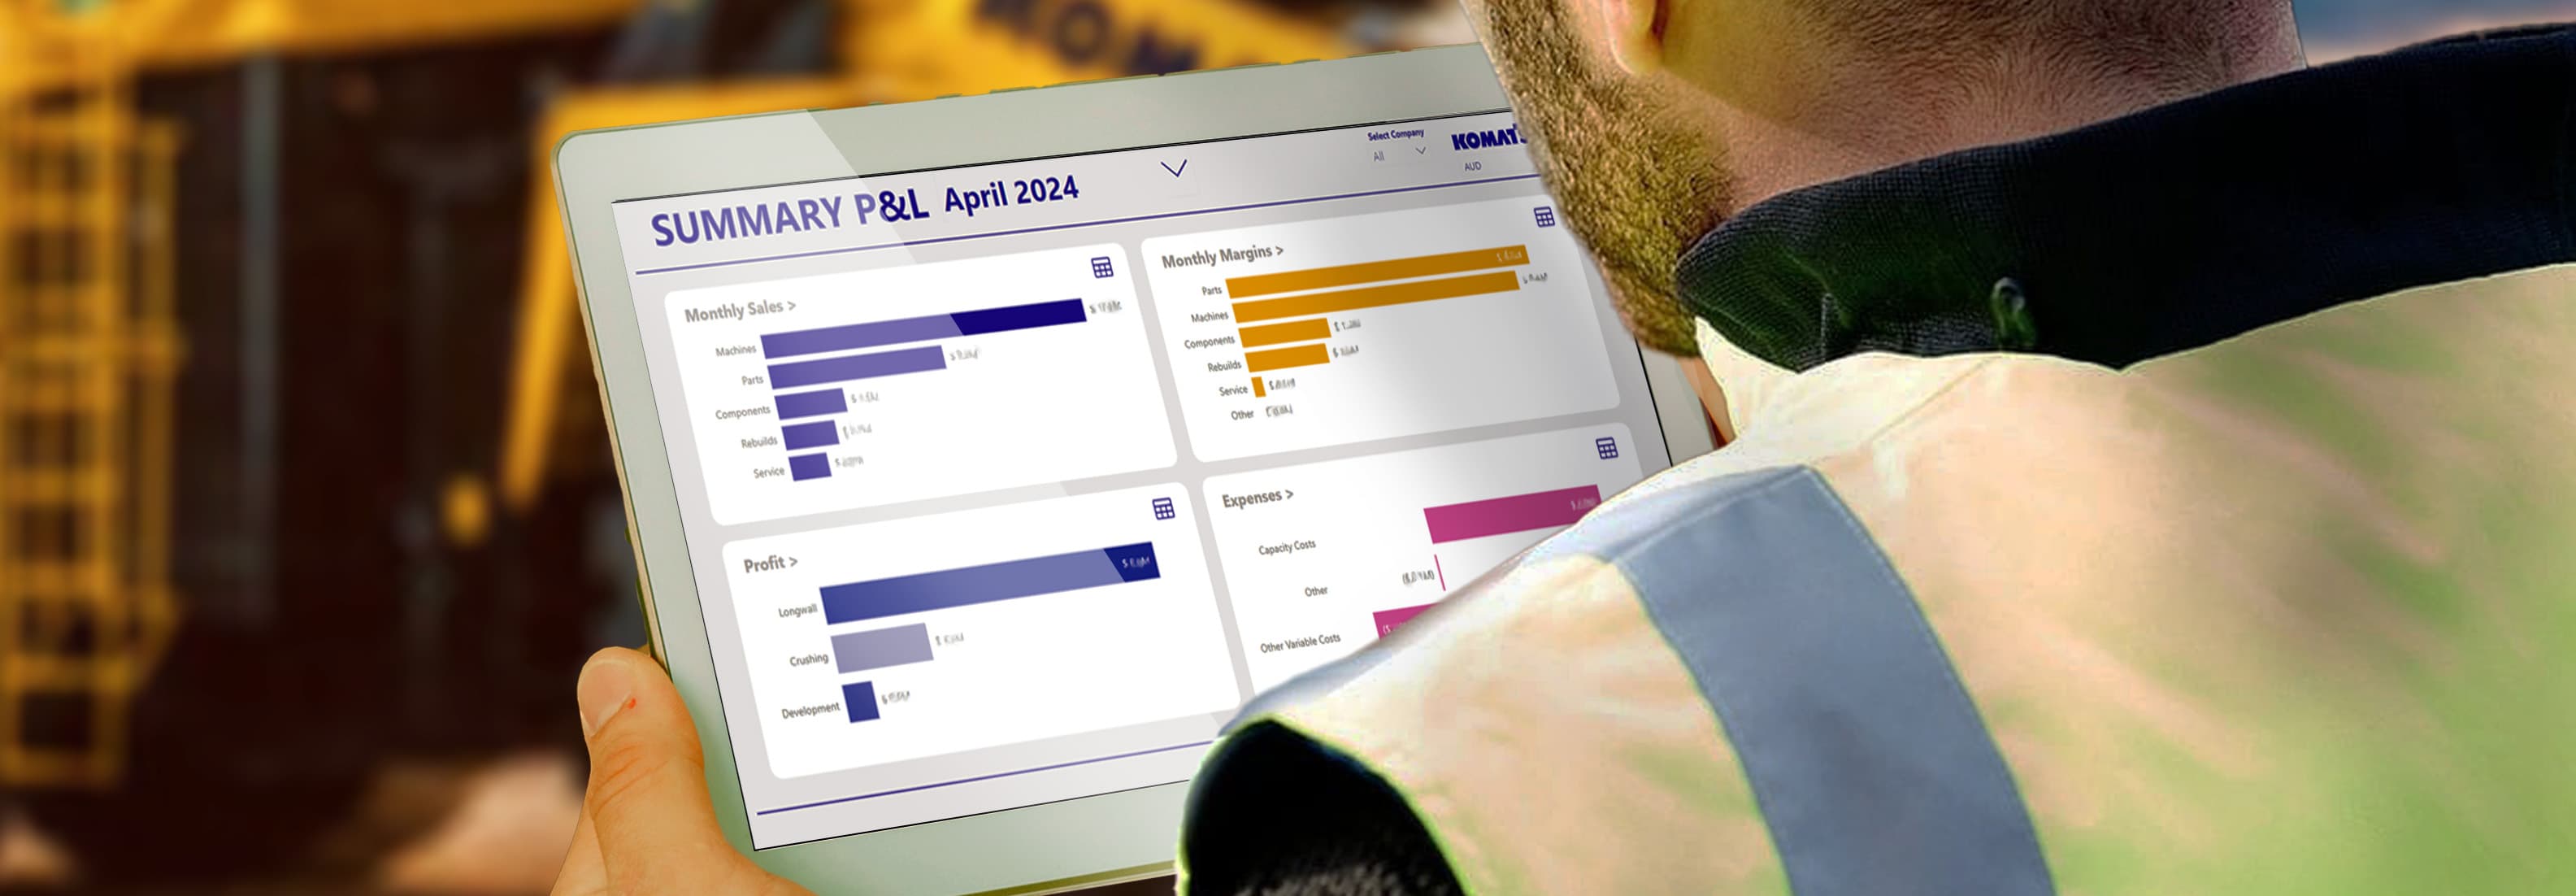
Komatsu Australia
We transitioned Komatsu Australia from a cumbersome manual process to automated financial reporting in Power BI, integrating data from SAP and Palantir Foundry.
50+ staff hours saved every month
Read the case studyThe questions buyers ask us
- What does reporting automation actually involve?
- Three layers: automating how data is collected and cleaned (the pipeline), automating how it is presented (the dashboard), and scheduling both so they refresh without anyone touching them. We build all three and prove the automated output matches your current numbers before switching over.
- How much time can reporting automation save?
- It varies with how manual the current process is, but the savings are usually large. Automating Komatsu Australia's financial reporting saved over 50 staff hours a month. The bigger win is often speed and trust: reports are ready on time and everyone works from the same figures.
- Can automated reports include written commentary?
- Yes. We build dynamic commentary that reads the current data and writes the plain-English summary automatically, for example, the airport passenger research reporting we automated for Lime Intelligence, where the narrative responds to filtering and data changes.
- Do you offer reporting automation in Brisbane?
- Yes. Motta Consulting delivers reporting automation from Brisbane to clients across Australia. We connect your data sources, encode the transformations once, and rebuild the output in Tableau or Power BI with scheduled refresh, so the report builds itself. Automating Komatsu Australia's financial reporting saved over 50 staff hours a month.
More in Data Visualisation
Tableau dashboards built around the decision, not the data
For teams who have Tableau (or want it) but need dashboards stakeholders actually rely on to make decisions.
Learn morePower BI consultingPower BI reporting that runs itself
For finance and operations teams drowning in manual monthly reporting who want it automated, accurate and on time.
Learn moreCustom data web appsCustom data web apps when a dashboard is not enough
For organisations whose need has outgrown a BI tool: they need data capture, workflow, or a fully bespoke interface.
Learn moreReady to talk it through?
For any team that spends days each month copying, pasting and reconciling data into a report by hand.