
SEQ corridor prioritisation, automated on Snowflake and Tableau
Department of Transport and Main Roads (Queensland): We developed an automated monitoring tool on Snowflake and Tableau to identify South East Queensland road corridors needing intervention and prioritise investment.
The challenge
Managing a growing city-region means answering a hundred versions of 'how is the network going?', asked by different teams, under different time pressures, and often after something has already gone wrong. The Department of Transport and Main Roads needed a way to support evidence-based operational and investment decisions across South East Queensland, ranking corridors from both Optimisation and Resilience perspectives.
Most transport performance reporting is still vehicle-centric, siloed by mode, and slow to refresh. Road and public transport metrics often live in separate worlds, and index scores can become black boxes when users cannot see what sits underneath them.
The brief was not to build another dashboard. It was to build a decision-support tool that is repeatable and automated, user-centred (measuring outcomes for people, not just vehicles), explainable so rankings can be defended, and fast to diagnose so teams can find the real bottleneck quickly. With Brisbane preparing to host the 2032 Olympic and Paralympic Games, getting insights as fast as data is ingested becomes an operational capability, not a nice-to-have.
Our approach
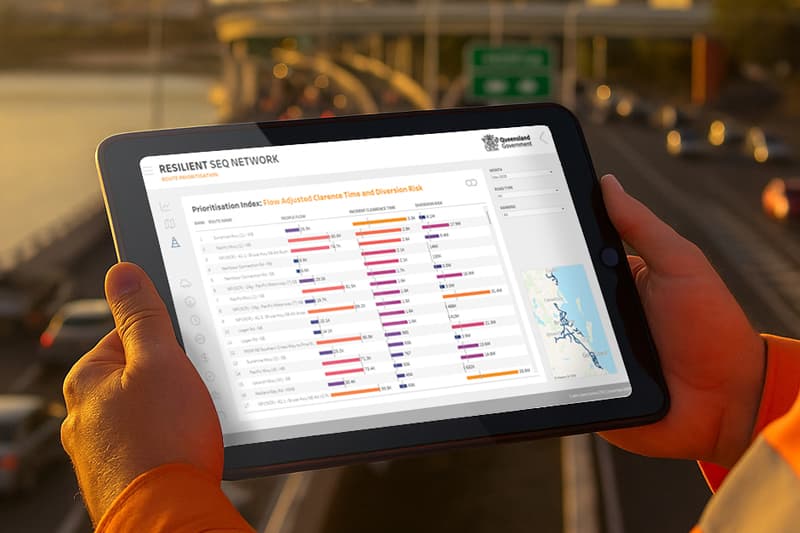
We delivered a Snowflake-backed prioritisation framework and a Tableau experience designed for rapid diagnosis, ranking corridors so users could move from an overall score to the underlying drivers and link-level bottlenecks.
In Snowflake, we built curated SQL views to encapsulate the business logic and standardise metrics across sources, giving consistent definitions and repeatable refresh cycles. The pipeline was designed to refresh in step with ingestion cadence, removing manual bottlenecks, important as the region prepares for major events where network conditions can change rapidly.
We drafted a full engineering memo evaluating five index options for corridor prioritisation, using TMR's Snowflake data to measure delay, efficiency, reliability and economic impact. We recommended a default after testing distribution, interpretability and alignment to user outcomes, while retaining multiple index views for different decision-making needs.
We shifted the tool from vehicle-first to people-first metrics, converting vehicle flow into people flow using occupancy rates (Flow times Occupancy) and integrating road and public transport measures, including bus passenger loadings, so performance reflects how many people are moved, not just how many vehicles pass a point.
We built a funnel-shaped visual journey so users move from a high-level index ranking, into a corridor and its contributing metric dashboards, and down to the specific links where performance drops (the bottleneck) in just a few clicks. Every index score was paired with its underlying drivers (flow, speed variation, reliability, congestion cost) so users can immediately see why a corridor ranks where it does.
The outcome
The biggest outcome was not a nicer dashboard. It was a faster path from signal to action. The prioritisation framework is automated, repeatable and transparent, and the dashboard is built for drill-down and bottleneck identification.
Snowflake views encapsulate the transformation logic, so outputs can refresh as frequently as upstream data allows.
The customer-experience lens improved: people flow replaced raw vehicle flow, with public transport passenger loadings incorporated where available, and users can move from corridor rankings to link-level metrics in a few clicks to support operational diagnosis.
Trust came through transparency: index views are backed by visible contributing metrics, so rankings can be explained, challenged and improved rather than taken on faith. The result is defensible, automated corridor prioritisation the department can rerun as conditions change.
Tools we used
- Snowflake
- Tableau
About Motta Consulting
Motta Consulting is a Brisbane-based data analytics, engineering and AI consultancy serving clients across Australia. We automate reporting, build modern data platforms, make data ready for AI, and build custom business apps - always starting with the decision, not the tool.
Related services
Want an outcome like this for your organisation?