
Operational transport dashboards field teams actually use
For transport and local-government teams whose operational dashboards have grown inconsistent, slow or hard for field staff to use.
Operational dashboards tend to sprawl: different teams build their own, definitions drift, and the people who most need them, field staff, find them slow and confusing.
The result is a suite of dashboards nobody fully trusts, and decisions made off the side in spreadsheets instead.
Understand first, then build
- 1
Understand
We start with the field staff and the operational decisions they make, then standardise the metrics behind the dashboards so everyone works from the same numbers.
- 2
Integrate
We integrate the data outputs (often on Snowflake) so the dashboards refresh from one governed source.
- 3
Redesign
We rebuild the interface and experience for the people using it day to day: clear, fast and consistent across the suite.
- 4
Hand over
We publish, secure and document the dashboards so your team can maintain and extend them.
Concrete deliverables
- Standardised operational dashboards in Tableau
- Integrated data outputs on Snowflake
- A redesigned interface tuned for field staff
- Governed, consistent metric definitions
- Documentation and team training
Tools we typically use
- Tableau
- Snowflake
- SQL
Not sure which tool fits? That’s our job. We recommend based on your stack and team, not our preferences.
Talk it through with usThe questions buyers ask us
- Can you standardise our existing transport dashboards?
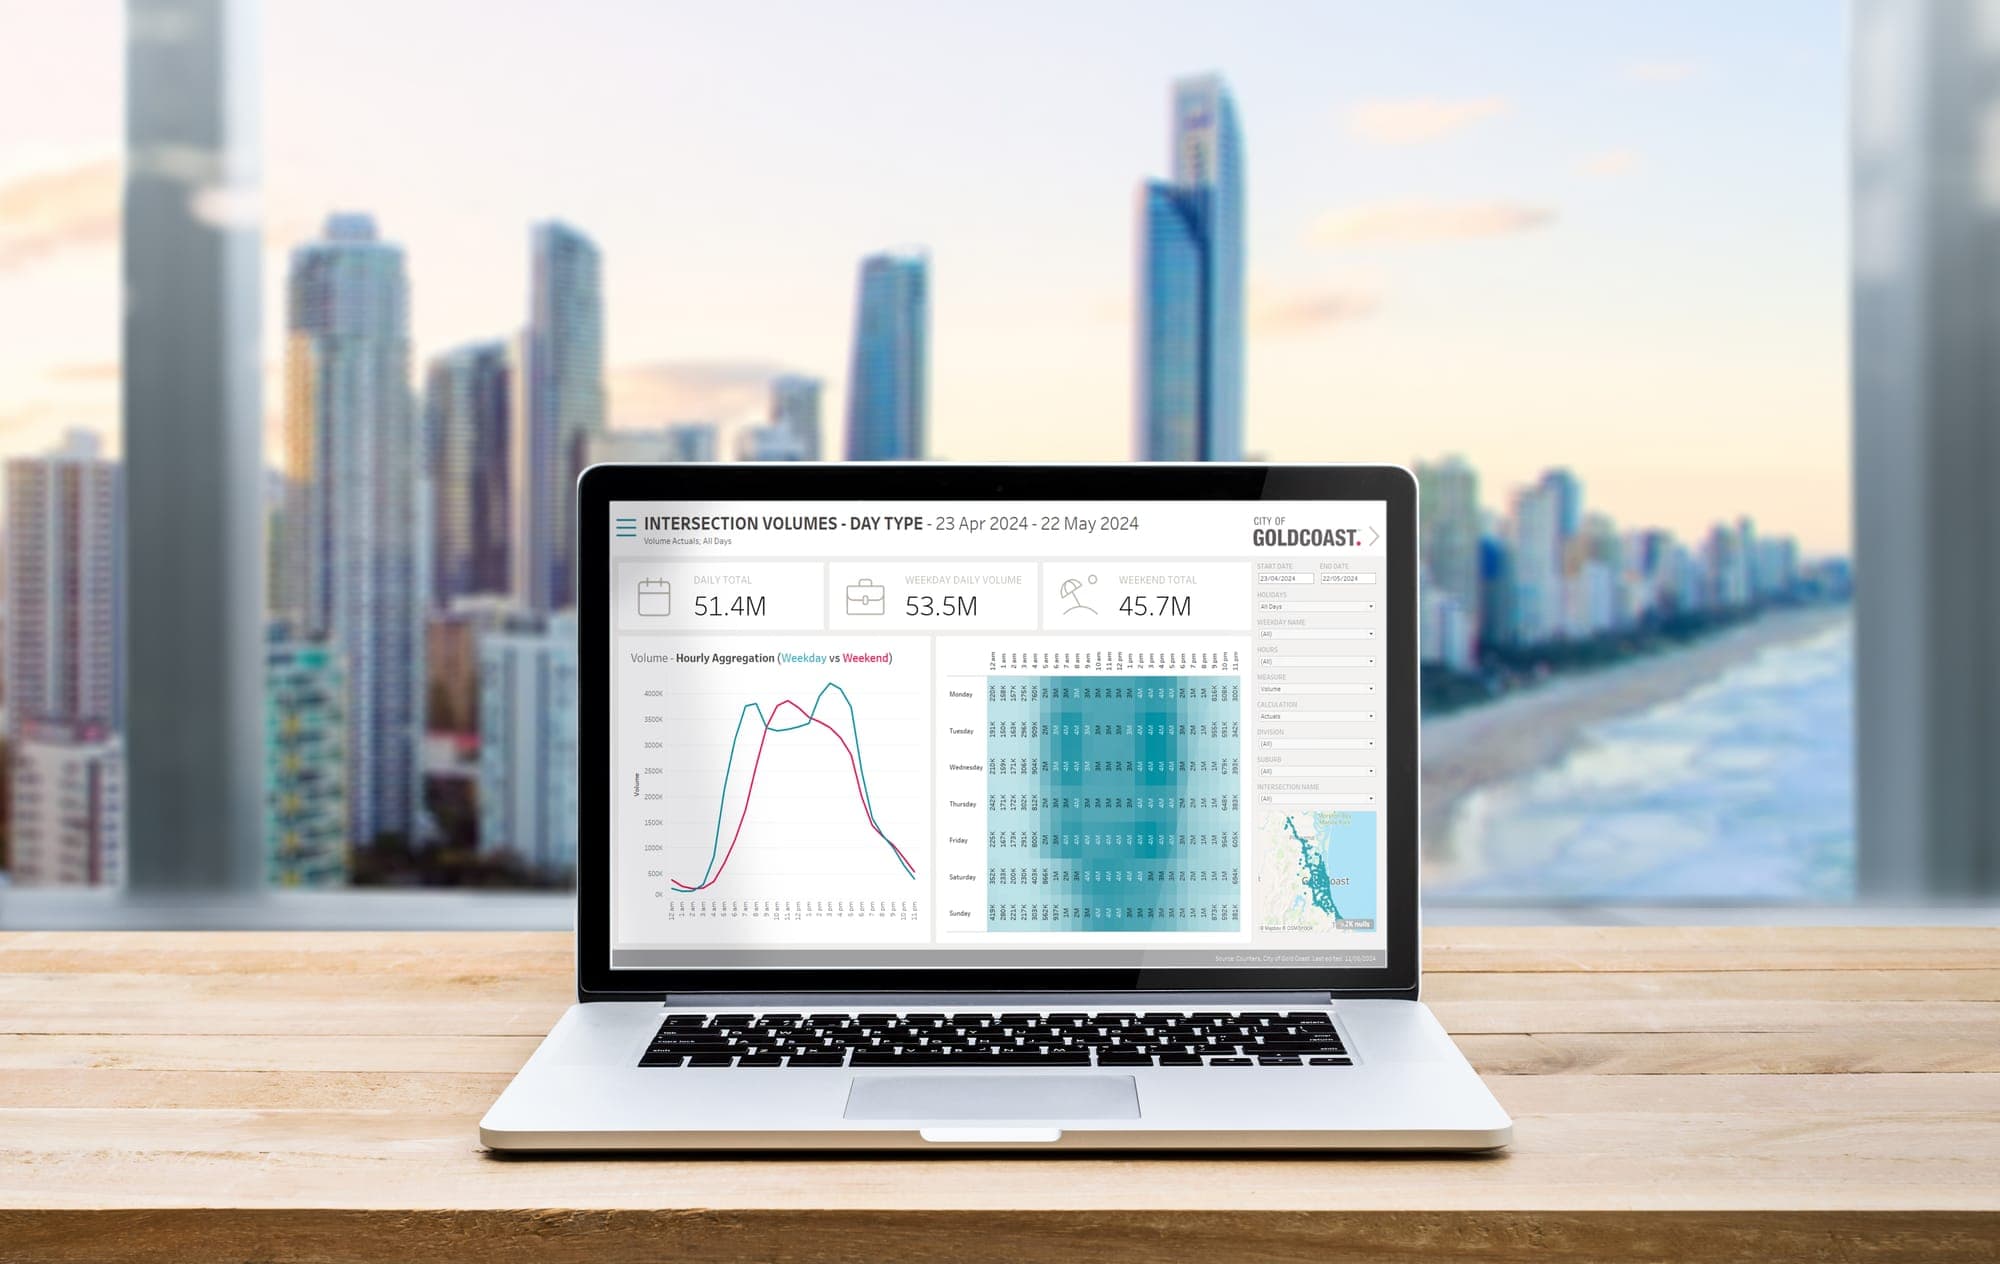
- Yes. That is a lot of what we do. We audit the existing suite, consolidate duplicated and drifting metrics into governed definitions, integrate the data outputs (often on Snowflake), and redesign the interface for the people using it. We did exactly this for the City of Gold Coast, improving the experience for field staff and streamlining the visualisation.
- Why do field staff struggle with dashboards?
- Usually because the dashboard was built for the analyst, not the person in the field who has seconds to find an answer. We design for that user (clear hierarchy, the key number first, and consistency across the suite) so the dashboards actually get used.
- Do you build transport dashboards in Brisbane?
- Yes. Motta Consulting builds operational transport dashboards from Brisbane for transport and local-government teams across Australia. We standardise the metrics, integrate the data on Snowflake, and redesign the interface in Tableau for field staff, as we did for the City of Gold Coast. Book a free consultation to discuss your dashboards.
More in Transport & Government Analytics
Prove the benefits your infrastructure investment was meant to deliver
For government agencies and infrastructure programs that must prioritise investments and demonstrate the benefits were actually realised.
Learn moreNetwork & corridor prioritisationKnow which corridors to invest in, and why
For transport agencies that need to decide where limited investment goes, and defend that decision under scrutiny.
Learn moreBusiness cases & options analysisGovernment business cases and options analysis that stand up to assurance
For government teams building business cases that have to pass assurance and justify significant investment.
Learn more
Ready to talk it through?
For transport and local-government teams whose operational dashboards have grown inconsistent, slow or hard for field staff to use.